Figure 3 and 4 - DE / GSEA PanCan
Waldron Lab
May 11, 2020
Source:vignettes/Figures3n4_GSEA_PanCan.Rmd
Figures3n4_GSEA_PanCan.RmdObtain ACC data from curatedTCGAData:
data("diseaseCodes")
head(avail <- diseaseCodes[
    diseaseCodes[["Available"]] == "Yes", "Study.Abbreviation"])
## [1] "ACC" "BLCA" "BRCA" "CESC" "CHOL" "COAD"Download and reshape data
Some datasets were missing normals and we suspected that there were different datasets being produced by RTCGAToolbox. Upon further inspection, TCGA provides ‘illuminaga’ and ‘illumina HiSeq’ datasets.
Note. First, download RTCGAToolbox from Bioc-devel and obtain correlations for samples that are in both platforms in “COAD”, “READ”, and “UCEC”.
dl <- c("COAD", "READ", "UCEC")
redl <- lapply(setNames(dl, dl), function(x) {
    tx <- getFirehoseData(x, RNASeq2GeneNorm = TRUE, clinical = FALSE)
    txl <- biocExtract(tx, "RNASeq2GeneNorm")
    sameSamps <- Reduce(intersect, lapply(txl, colnames))

    # correlation between platforms 'illuminaga' and 'illuminahiseq'
    message(x)
    datm <- do.call(cbind.data.frame,
        lapply(txl, function(g) { assay(g[,sameSamps]) })
    )
    if (length(datm))
        print(cor(datm[,1], datm[,2]))

    newassay <- cbind(assay(txl[[1]]), assay(txl[[2]]))
    newassay <- data.matrix(newassay[, !duplicated(colnames(newassay))])
    newmeta <- c(metadata(txl[[1]]), metadata(txl[[2]]))
    newColData <- DataFrame(row.names = colnames(newassay))
    SummarizedExperiment(assays = list(TPM = newassay),
        metadata = newmeta, colData = newColData)
    }
)
## [1] 0.927677
## [1] 0.8698399
exper <- as(redl, "ExperimentList") sampleTables(MultiAssayExperiment(exper))
## $COAD
##
##  01  02  06  11
## 457   1   1  41
##
## $READ
##
##  01  02  11
## 166   1  10
##
## $UCEC
##
##  01  02  11
## 545   1  35
Create a pseudo clinical DataFrame for new samples
allSamps <- unlist(colnames(exper))
clinphone <- DataFrame(patientID = TCGAbarcode(allSamps))
rownames(clinphone) <- clinphone[["patientID"]]
sum(duplicated(rownames(clinphone)))
## [1] 77## [1] 77 clinphone <- clinphone[!duplicated(rownames(clinphone)), , drop = FALSE]
Combine cancer datasets into one MultiAssayExperiment:
outAssays <- c("COAD_RNASeq2GeneNorm-20160128",
    "READ_RNASeq2GeneNorm-20160128", "UCEC_RNASeq2GeneNorm-20160128")
core <- exper[ c("COAD", "READ", "UCEC") ]
names(core) <- outAssays
mapper <- generateMap(core, clinphone, idConverter = TCGAbarcode)
coremae <-
    MultiAssayExperiment(
        experiments = core, sampleMap = mapper, colData = clinphone
    )
PanCan RNASeq2*
Obtain the RNAseq data from curatedTCGAData:
rnacomp <- curatedTCGAData("*", "RNASeq2*", FALSE)
rnacomp
## A MultiAssayExperiment object of 33 listed
##  experiments with user-defined names and respective classes.
##  Containing an ExperimentList class object of length 33:
##  [1] ACC_RNASeq2GeneNorm-20160128: SummarizedExperiment with 20501 rows and 79 columns
##  [2] BLCA_RNASeq2GeneNorm-20160128: SummarizedExperiment with 20501 rows and 427 columns
##  [3] BRCA_RNASeq2GeneNorm-20160128: SummarizedExperiment with 20501 rows and 1212 columns
##  [4] CESC_RNASeq2GeneNorm-20160128: SummarizedExperiment with 20501 rows and 309 columns
##  [5] CHOL_RNASeq2GeneNorm-20160128: SummarizedExperiment with 20501 rows and 45 columns
##  [6] COAD_RNASeq2GeneNorm-20160128: SummarizedExperiment with 20501 rows and 191 columns
##  [7] DLBC_RNASeq2GeneNorm-20160128: SummarizedExperiment with 20501 rows and 48 columns
##  [8] ESCA_RNASeq2GeneNorm-20160128: SummarizedExperiment with 20501 rows and 196 columns
##  [9] GBM_RNASeq2GeneNorm-20160128: SummarizedExperiment with 20501 rows and 166 columns
##  [10] HNSC_RNASeq2GeneNorm-20160128: SummarizedExperiment with 20501 rows and 566 columns
##  [11] KICH_RNASeq2GeneNorm-20160128: SummarizedExperiment with 20501 rows and 91 columns
##  [12] KIRC_RNASeq2GeneNorm-20160128: SummarizedExperiment with 20501 rows and 606 columns
##  [13] KIRP_RNASeq2GeneNorm-20160128: SummarizedExperiment with 20501 rows and 323 columns
##  [14] LAML_RNASeq2GeneNorm-20160128: SummarizedExperiment with 20501 rows and 173 columns
##  [15] LGG_RNASeq2GeneNorm-20160128: SummarizedExperiment with 20501 rows and 530 columns
##  [16] LIHC_RNASeq2GeneNorm-20160128: SummarizedExperiment with 20501 rows and 423 columns
##  [17] LUAD_RNASeq2GeneNorm-20160128: SummarizedExperiment with 20501 rows and 576 columns
##  [18] LUSC_RNASeq2GeneNorm-20160128: SummarizedExperiment with 20501 rows and 552 columns
##  [19] MESO_RNASeq2GeneNorm-20160128: SummarizedExperiment with 20501 rows and 87 columns
##  [20] OV_RNASeq2GeneNorm-20160128: SummarizedExperiment with 20501 rows and 307 columns
##  [21] PAAD_RNASeq2GeneNorm-20160128: SummarizedExperiment with 20501 rows and 183 columns
##  [22] PCPG_RNASeq2GeneNorm-20160128: SummarizedExperiment with 20501 rows and 187 columns
##  [23] PRAD_RNASeq2GeneNorm-20160128: SummarizedExperiment with 20501 rows and 550 columns
##  [24] READ_RNASeq2GeneNorm-20160128: SummarizedExperiment with 20501 rows and 72 columns
##  [25] SARC_RNASeq2GeneNorm-20160128: SummarizedExperiment with 20501 rows and 265 columns
##  [26] SKCM_RNASeq2GeneNorm-20160128: SummarizedExperiment with 20501 rows and 473 columns
##  [27] STAD_RNASeq2GeneNorm-20160128: SummarizedExperiment with 20501 rows and 450 columns
##  [28] TGCT_RNASeq2GeneNorm-20160128: SummarizedExperiment with 20501 rows and 139 columns
##  [29] THCA_RNASeq2GeneNorm-20160128: SummarizedExperiment with 20501 rows and 568 columns
##  [30] THYM_RNASeq2GeneNorm-20160128: SummarizedExperiment with 20501 rows and 122 columns
##  [31] UCEC_RNASeq2GeneNorm-20160128: SummarizedExperiment with 20501 rows and 380 columns
##  [32] UCS_RNASeq2GeneNorm-20160128: SummarizedExperiment with 20501 rows and 57 columns
##  [33] UVM_RNASeq2GeneNorm-20160128: SummarizedExperiment with 20501 rows and 80 columns
## Features:
##  experiments() - obtain the ExperimentList instance
##  colData() - the primary/phenotype DFrame
##  sampleMap() - the sample availability DFrame
##  `$`, `[`, `[[` - extract colData columns, subset, or experiment
##  *Format() - convert into a long or wide DFrame
##  assays() - convert ExperimentList to a SimpleList of matrices
Replace above processed datasets in the full RNASeq MultiAssayExperiment:
rnacopy <- rnacomp
rnacomp <- rnacomp[, , !names(rnacomp) %in% outAssays]
## harmonizing input:
##   removing 643 sampleMap rows not in names(experiments)
##   removing 633 colData rownames not in sampleMap 'primary'
rnacomp <- c(rnacomp, coremae)
Here we check for the samples of interest using sampleTables:
sampleTables(rnacomp)
## $`ACC_RNASeq2GeneNorm-20160128`
##
## 01
## 79
##
## $`BLCA_RNASeq2GeneNorm-20160128`
##
##  01  11
## 408  19
##
## $`BRCA_RNASeq2GeneNorm-20160128`
##
##   01   06   11
## 1093    7  112
##
## $`CESC_RNASeq2GeneNorm-20160128`
##
##  01  06  11
## 304   2   3
##
## $`CHOL_RNASeq2GeneNorm-20160128`
##
## 01 11
## 36  9
##
## $`DLBC_RNASeq2GeneNorm-20160128`
##
## 01
## 48
##
## $`ESCA_RNASeq2GeneNorm-20160128`
##
##  01  06  11
## 184   1  11
##
## $`GBM_RNASeq2GeneNorm-20160128`
##
##  01  02
## 153  13
##
## $`HNSC_RNASeq2GeneNorm-20160128`
##
##  01  06  11
## 520   2  44
##
## $`KICH_RNASeq2GeneNorm-20160128`
##
## 01 11
## 66 25
##
## $`KIRC_RNASeq2GeneNorm-20160128`
##
##  01  05  11
## 533   1  72
##
## $`KIRP_RNASeq2GeneNorm-20160128`
##
##  01  05  11
## 290   1  32
##
## $`LAML_RNASeq2GeneNorm-20160128`
##
##  03
## 173
##
## $`LGG_RNASeq2GeneNorm-20160128`
##
##  01  02
## 516  14
##
## $`LIHC_RNASeq2GeneNorm-20160128`
##
##  01  02  11
## 371   2  50
##
## $`LUAD_RNASeq2GeneNorm-20160128`
##
##  01  02  11
## 515   2  59
##
## $`LUSC_RNASeq2GeneNorm-20160128`
##
##  01  11
## 501  51
##
## $`MESO_RNASeq2GeneNorm-20160128`
##
## 01
## 87
##
## $`OV_RNASeq2GeneNorm-20160128`
##
##  01  02
## 303   4
##
## $`PAAD_RNASeq2GeneNorm-20160128`
##
##  01  06  11
## 178   1   4
##
## $`PCPG_RNASeq2GeneNorm-20160128`
##
##  01  05  06  11
## 179   3   2   3
##
## $`PRAD_RNASeq2GeneNorm-20160128`
##
##  01  06  11
## 497   1  52
##
## $`SARC_RNASeq2GeneNorm-20160128`
##
##  01  02  06  11
## 259   3   1   2
##
## $`SKCM_RNASeq2GeneNorm-20160128`
##
##  01  06  07  11
## 103 368   1   1
##
## $`STAD_RNASeq2GeneNorm-20160128`
##
##  01  11
## 415  35
##
## $`TGCT_RNASeq2GeneNorm-20160128`
##
##  01  05
## 134   5
##
## $`THCA_RNASeq2GeneNorm-20160128`
##
##  01  06  11
## 501   8  59
##
## $`THYM_RNASeq2GeneNorm-20160128`
##
##  01  11
## 120   2
##
## $`UCS_RNASeq2GeneNorm-20160128`
##
## 01
## 57
##
## $`UVM_RNASeq2GeneNorm-20160128`
##
## 01
## 80
##
## $`COAD_RNASeq2GeneNorm-20160128`
##
##  01  02  06  11
## 457   1   1  41
##
## $`READ_RNASeq2GeneNorm-20160128`
##
##  01  02  11
## 166   1  10
##
## $`UCEC_RNASeq2GeneNorm-20160128`
##
##  01  02  11
## 545   1  35
Which cancer codes have both tumors and normal samples?
okCA <- vapply(sampleTables(rnacomp),
    function(x) {
        all(c("01", "11") %in% names(x))
    },
    logical(1L)
)

(
okCodes <- vapply(
    strsplit(names(which(okCA)), "_"),
    `[`,
    character(1L),
    1L)
)
##  [1] "BLCA" "BRCA" "CESC" "CHOL" "ESCA" "HNSC" "KICH" "KIRC" "KIRP" "LIHC"
## [11] "LUAD" "LUSC" "PAAD" "PCPG" "PRAD" "SARC" "SKCM" "STAD" "THCA" "THYM"
## [21] "COAD" "READ" "UCEC"
Assemble appropriate MultiAssayExperiment object with cancer codes that have both tumors and normals.
rnacomp2 <- rnacomp[ , , okCA]
## harmonizing input:
##   removing 1666 sampleMap rows not in names(experiments)
##   removing 1638 colData rownames not in sampleMap 'primary'
Isolate tumor and normal samples for each cancer that have more than 10 samples of each:
selects <- TCGAsampleSelect(colnames(rnacomp2), c("01", "11"))

rnacomp3 <- rnacomp2[, selects]
## harmonizing input:
##   removing 410 sampleMap rows with 'colname' not in colnames of experiments
##   removing 365 colData rownames not in sampleMap 'primary'
enoughNorm <- vapply(sampleTables(rnacomp3), function(samp) { samp["11"] >= 10L }, logical(1L)) rnacomp4 <- rnacomp3[, , enoughNorm]
## harmonizing input:
##   removing 1203 sampleMap rows not in names(experiments)
## removing 1180 colData rownames not in sampleMap 'primary'sampleTables(rnacomp4)
## $`BLCA_RNASeq2GeneNorm-20160128`
##
##  01  11
## 408  19
##
## $`BRCA_RNASeq2GeneNorm-20160128`
##
##   01   11
## 1093  112
##
## $`ESCA_RNASeq2GeneNorm-20160128`
##
##  01  11
## 184  11
##
## $`HNSC_RNASeq2GeneNorm-20160128`
##
##  01  11
## 520  44
##
## $`KICH_RNASeq2GeneNorm-20160128`
##
## 01 11
## 66 25
##
## $`KIRC_RNASeq2GeneNorm-20160128`
##
##  01  11
## 533  72
##
## $`KIRP_RNASeq2GeneNorm-20160128`
##
##  01  11
## 290  32
##
## $`LIHC_RNASeq2GeneNorm-20160128`
##
##  01  11
## 371  50
##
## $`LUAD_RNASeq2GeneNorm-20160128`
##
##  01  11
## 515  59
##
## $`LUSC_RNASeq2GeneNorm-20160128`
##
##  01  11
## 501  51
##
## $`PRAD_RNASeq2GeneNorm-20160128`
##
##  01  11
## 497  52
##
## $`STAD_RNASeq2GeneNorm-20160128`
##
##  01  11
## 415  35
##
## $`THCA_RNASeq2GeneNorm-20160128`
##
##  01  11
## 501  59
##
## $`COAD_RNASeq2GeneNorm-20160128`
##
##  01  11
## 457  41
##
## $`READ_RNASeq2GeneNorm-20160128`
##
##  01  11
## 166  10
##
## $`UCEC_RNASeq2GeneNorm-20160128`
##
##  01  11
## 545  35
Create an index to annotate each of the SummarizedExperiment objects contained in the ExperimentList:
tlogic <- TCGAsampleSelect(colnames(rnacomp4), "01")
sampIndx <- IntegerList(lapply(tlogic, ifelse, 1L, 0L))

naks <- mendoapply(function(x, y) {
    colData(x)[["GROUP"]] <- y
    colData(x)[["BLOCK"]] <- TCGAbarcode(rownames(colData(x)))
    x
}, x = experiments(rnacomp4), y = sampIndx)

rnacomp5 <- BiocGenerics:::replaceSlots(rnacomp4,
    ExperimentList = naks,
    check = FALSE)

table(rnacomp5[[1L]]$GROUP)
##
##   0   1
##  19 408
Split, create matched tumors and normals, and then recombine into a single MultiAssayExperiment:
matchlist <- lapply(setNames(seq_along(rnacomp5), names(rnacomp5)),
    function(idx) {
        as(splitAssays(rnacomp5[, , idx]), "MatchedAssayExperiment")
    }
)
newEXPS <- ExperimentList(
    lapply(matchlist, function(expr) {
        do.call(cbind, experiments(expr))
    })
)

rnacomp6 <- BiocGenerics:::replaceSlots(rnacomp5,
    ExperimentList = newEXPS,
    check = FALSE
)
Save point:
saveRDS(experiments(rnacomp6), file = "../inst/data/pancan_exprs.rds")
r6ex <- loadRDS(file = "../inst/data/pancan_exprs.rds")
Differential Expression analysis:
exp.list <- experiments(rnacomp6)
names(exp.list) <- substring(names(exp.list), 1, 4)
exp.list <- lapply(exp.list,
    function(se)
    {
        # if assay is matrix: assay(se) <- log(assay(se) + 1, base=2)
        assays(se) <- list(TPM=log(as.matrix(assay(se)) + 1, base=2))
        return(se)
    })
exp.list <- runDE(exp.list)
# for(n in names(exp.list)) saveRDS(exp.list[[n]], file = paste(n, "rds", sep="."))
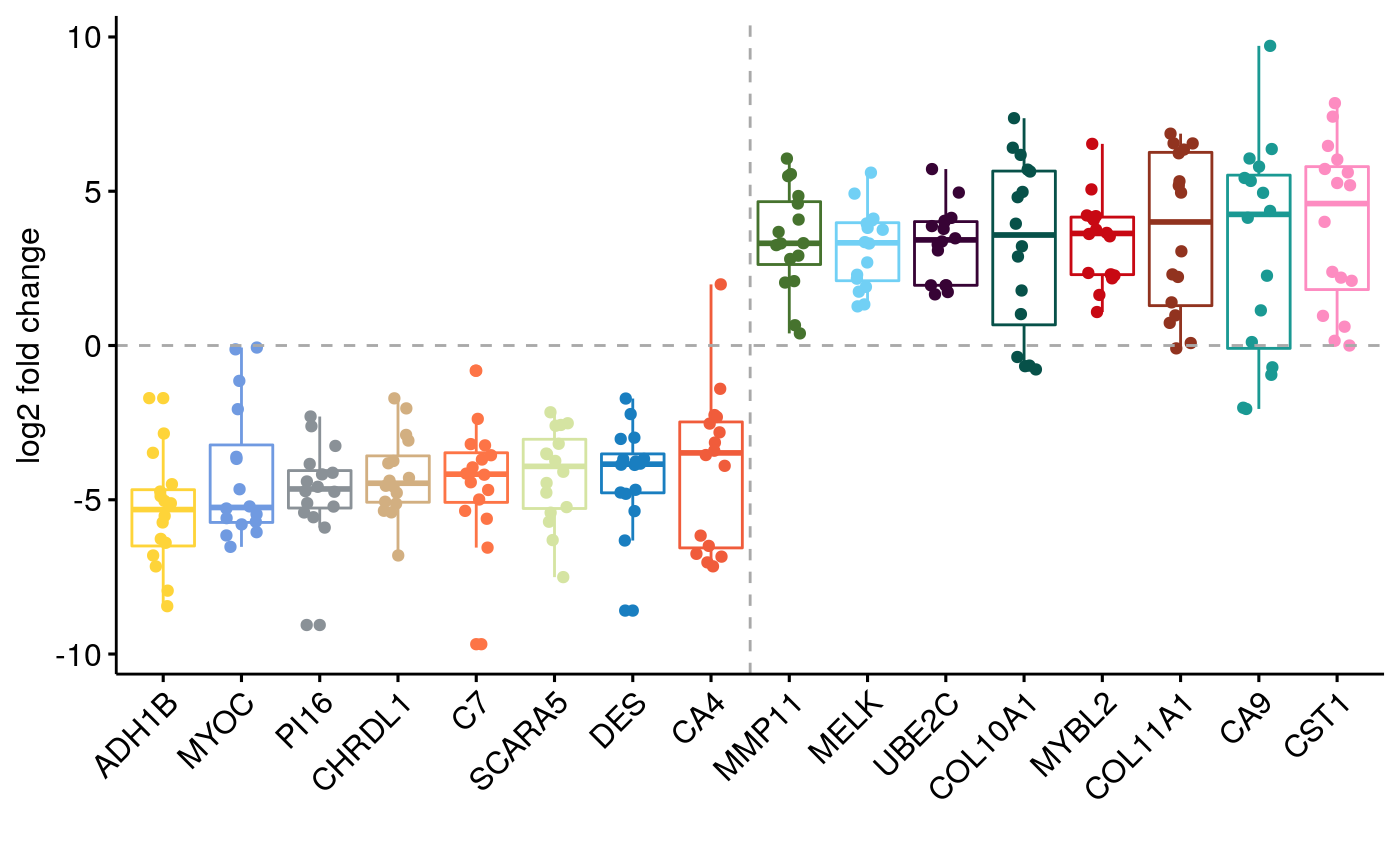
Figure 3 BoxPlot
Extract genes with consistent expression changes:
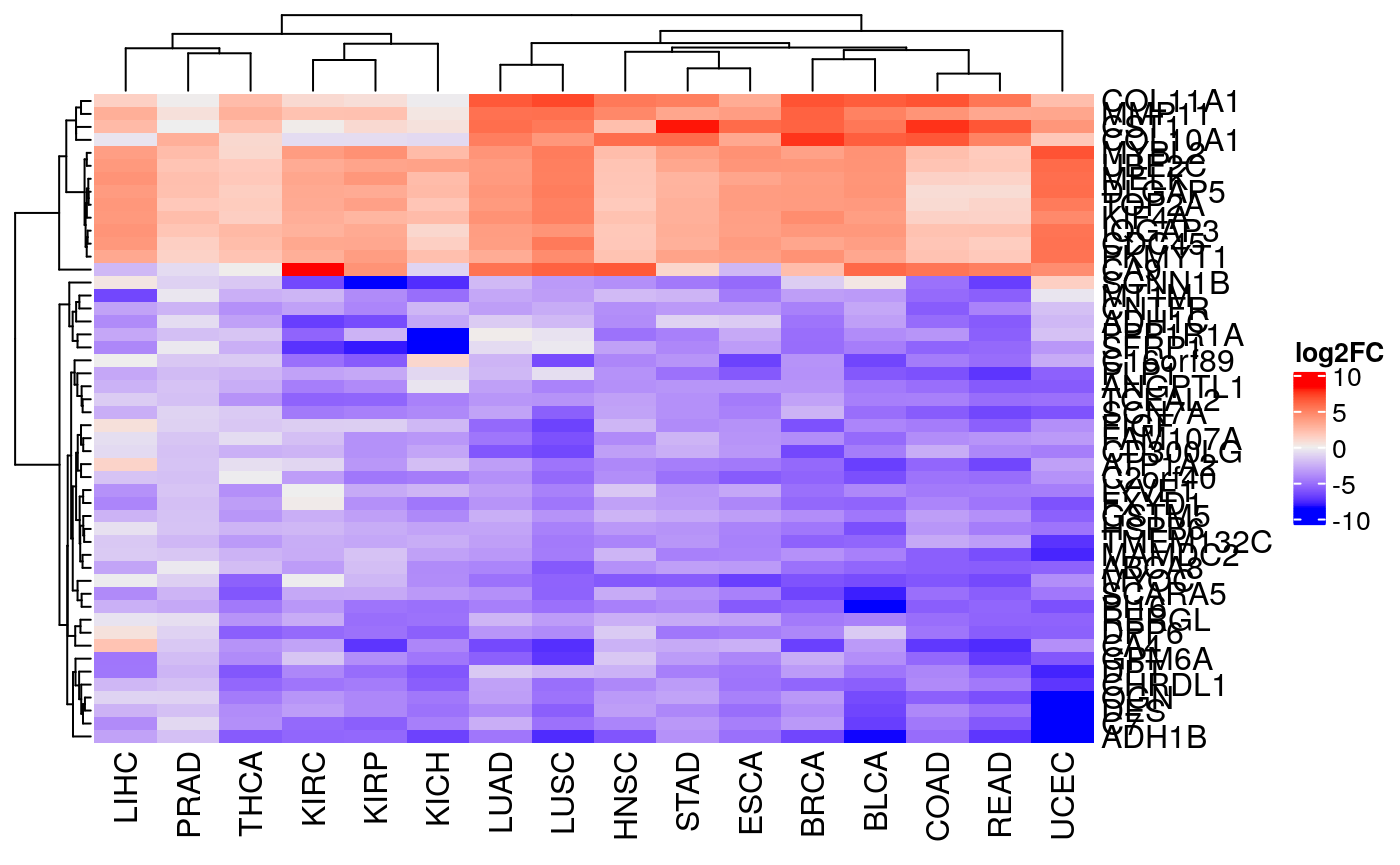
wfcs <- metaFC(exp.list, max.na=3)

# Heatmap
top.wfcs.genes <- names(wfcs)[1:50]
extractFC <- function(exp.list, top.wfcs.genes)
{
    fcs <- vapply(exp.list,
        function(d) rowData(d)[top.wfcs.genes, "FC"],
        numeric(length(top.wfcs.genes)))
    rownames(fcs) <- top.wfcs.genes
    return(fcs)
}
fcs <- extractFC(exp.list, top.wfcs.genes)

# pdf("log2fc.pdf", paper = "special", width = 8, height = 12)
Heatmap(fcs, name="log2FC", show_row_names=TRUE)
# dev.off()
Figure 3
Pan-cancer differential expression analysis
# Boxplot
top.wfcs.genes <- names(c(wfcs[wfcs > 0][1:8], wfcs[wfcs < 0][1:8]))
fcs <- extractFC(exp.list, top.wfcs.genes)
df <- reshape2::melt(fcs)
medians <- apply(fcs, 1, median, na.rm=TRUE)
o <- names(sort(medians))
p <- ggboxplot(df, x = "Var1", y = "value", width = 0.8,
    ylab="log2 fold change", xlab="", order=o, color="Var1", add ="jitter")
p <- ggpar(p, x.text.angle=45, palette = "simpsons", legend="none")
gg <- p + geom_hline(yintercept=0, linetype="dashed", color = "darkgrey") +
    geom_vline(xintercept=8.5, linetype="dashed", color = "darkgrey")
gg
ggsaving…
ggsave("boxplot_pancan.svg", gg, device = "svg")

## pdf
ggsave("boxplot_pancan.pdf", gg, device = "pdf")
GSEA
ID mapping
Obtain gene sets
go.gs <- getGenesets(org="hsa", db="go")
## ids <- vapply(names(go.gs), function(n) unlist(strsplit(n, "_"))[1], character(1)) ids <- sub(":", "", ids) extractTitle <- function(n) { spl <- unlist(strsplit(n, "_"))[-1] paste(spl, collapse = " ") } go.i2n <- vapply(names(go.gs), extractTitle, character(1)) names(go.i2n) <- ids
Execute ORA (has been pre-computed on a cluster, skip this step):
res <- runEA(exp.list, methods=c("ora", "padog"),
    gs=go.gs, perm=c(0, 1000), save2file=TRUE, out.dir="../inst/data")
Read pre-computed results for ORA and PADOG for GO-BP gene sets
res <- readResults(data.dir="../inst/data", data.ids=names(exp.list),
    methods=c("ora", "padog"), type="ranking")
Determine enrichment across datasets:
isEnriched <- function(res, pthresh=0.05, nr.top=1:15)
{
    for(i in seq_along(res)) rownames(res[[i]]) <- res[[i]]$GENE.SET
    pmat <- vapply(res, function(r) r[rownames(res[[1]]), "PVAL"], res[[1]]$PVAL)
    rownames(pmat) <- rownames(res[[1]])
    is.enriched <- pmat < pthresh
    rse <- rowSums(is.enriched)

    top.gs <- names(sort(rse, decreasing=TRUE)[nr.top])
    top.mat <- is.enriched[top.gs,]
    mode(top.mat) <- "integer"
    return(top.mat)
}

go.ora <- isEnriched(res$ora)
go.padog <- isEnriched(res$padog, nr.top=rownames(go.ora))

rownames(go.ora) <- rownames(go.padog) <- go.i2n[rownames(go.ora)]
extract <- function(n, ind) paste(unlist(strsplit(n, " "))[ind], collapse = " ")
rownames(go.ora)[4] <- extract(rownames(go.ora)[4], 1:2)
rownames(go.ora)[10] <- extract(rownames(go.ora)[10], c(1, 3:4))
rownames(go.ora)[11] <- extract(rownames(go.ora)[11], 1:2)
rownames(go.ora)[15] <- extract(rownames(go.ora)[15], 1:5)

rownames(go.padog) <- rownames(go.ora)
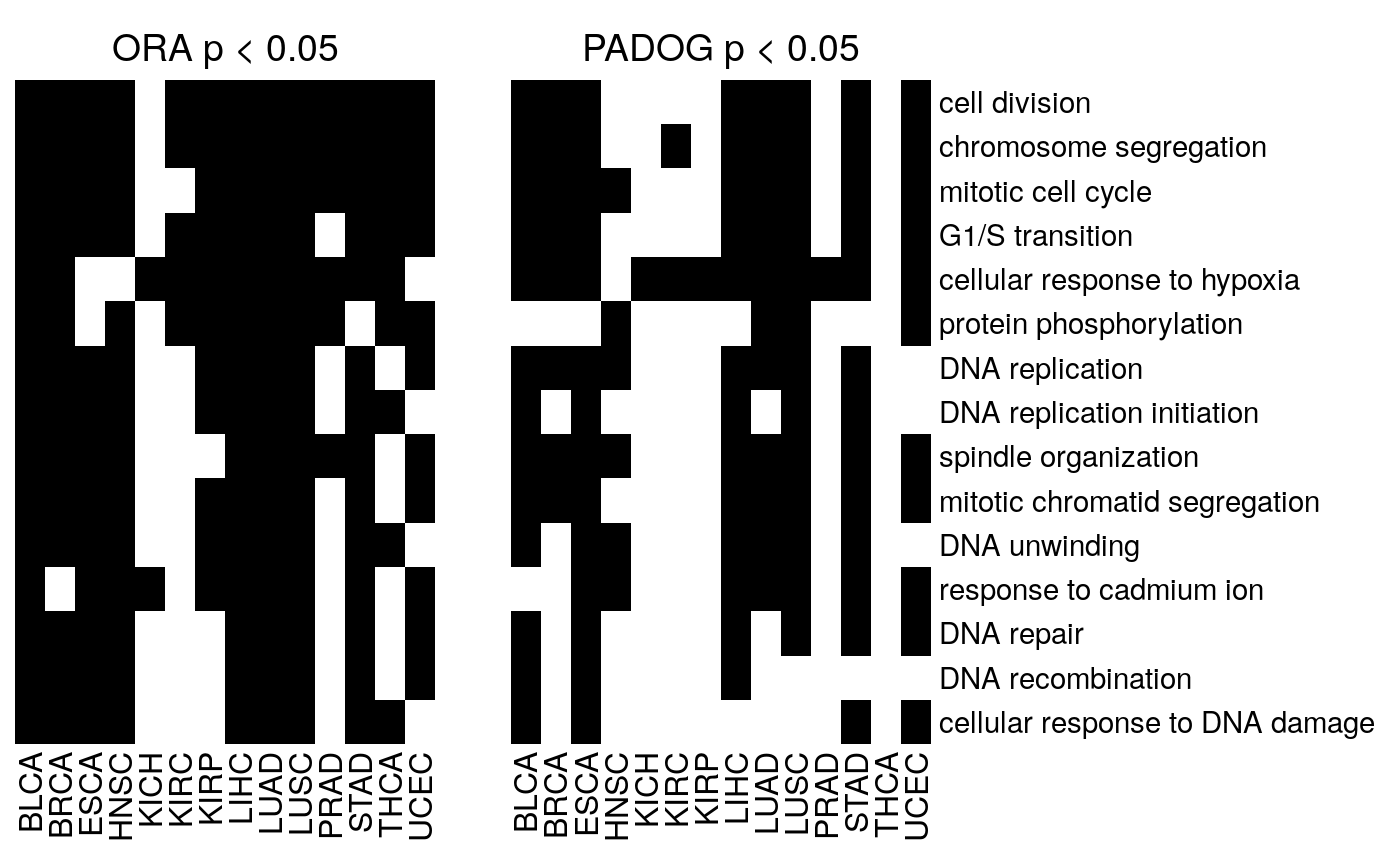
Figure 4
Pan-cancer gene set enrichment analysis
h1 <- Heatmap(go.ora, cluster_rows=FALSE, cluster_columns=FALSE,
    show_row_names=FALSE, show_heatmap_legend = FALSE,
    col=c("white", "black"), column_title="ORA p < 0.05",
    row_names_gp = gpar(fontsize = 11))
h2 <- Heatmap(go.padog, cluster_rows=FALSE, cluster_columns=FALSE,
    show_row_names=TRUE, show_heatmap_legend = FALSE,
    col=c("white", "black"), column_title="PADOG p < 0.05",
    row_names_gp = gpar(fontsize = 11))
hl <- h1 + h2
draw(hl, ht_gap = unit(1, "cm"))
Code for saving to PDF: